| AWS | |
| AWS EC2 Compute costs | Displays EC2 instance running hours and attached storage usage. Helps identify usage patterns and potential over-provisioning. |
| AWS EC2 Compute & Storage Usage (Running Hours & GB) | Track EC2 instance running hours alongside associated storage usage in gigabytes. This dashboard helps you understand usage patterns and spot over-provisioned or underutilized resources. |
| AWS S3 and Storage cost | Analyze your AWS S3 and other storage-related costs, including usage by storage class and bucket. Useful for identifying cost drivers and opportunities to optimize long-term storage. |
| AWS RDS Compute & Storage Usage (Running Hours & GB) | See detailed RDS instance runtime and storage usage over time. This dashboard helps you align database compute and storage with actual demand to reduce waste. |
| AWS RDS Compute costs | Focuses specifically on the compute portion of your RDS spend. Ideal for monitoring cost efficiency by instance type, region, or database engine. |
| AWS ElastiCache Compute costs | Visualizes ElastiCache compute costs across instance types and regions. Helps identify scaling inefficiencies or underused clusters in your caching layer. |
| AI Overview | A high-level dashboard of AI spend in AWS that compares total costs, tracks AI as a share of overall cloud spend, views spend by AWS services, and forecasts future investments. |
| GCP | |
| GCP Compute costs | Breaks down GCP compute expenses by service, project, and instance type. Use this dashboard to monitor usage trends and optimize your GCP virtual machines. |
| GCP Storage | Provides visibility into GCP storage usage and costs by bucket, class, and region. Helps track growth and optimize storage tier usage over time. |
| GCP Networking | Highlights GCP networking costs such as egress and inter-region traffic. Useful for monitoring high-volume data movement and controlling data transfer spend. |
| GCP Commitments | Shows your committed use discounts (CUDs) and how they’re applied across your GCP environment. Helps track utilization and spot unused commitments. |
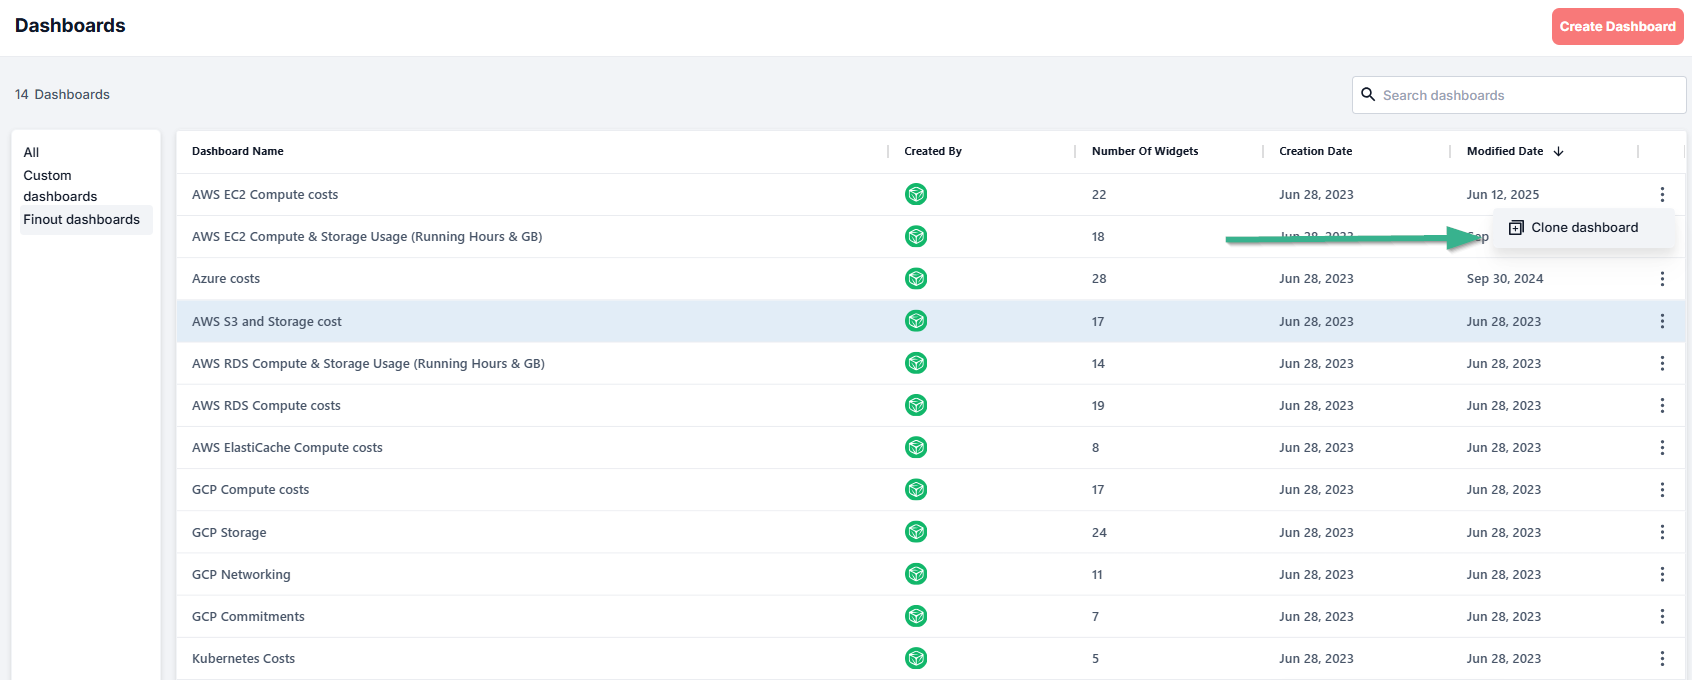
| Finops for AI GCP Dashboard | This dashboard provides a high-level view of AI spending across your GCP environment, allowing you to compare total AI spend, measure AI as a percentage of overall cloud costs, and forecast future investments. It’s a pre-built dashboard designed to help you get started quickly. To customize it—such as filtering by team, adjusting time ranges, or adding metrics—clone the dashboard and edit your version under Custom Dashboards. |
| Azure | |
| Azure costs | Get a high-level view of your Azure cloud spend, broken down by services, resource groups, and regions. Use this dashboard to monitor trends and optimize usage across your Azure environment. |
| FinOps for AI Azure Dashboard – Alpha | An early-stage dashboard focused on monitoring Azure AI spend. Track service-level usage, identify spending trends, and visualize cost distribution across models, tokens, and subscriptions. |
| Kubernetes | |
| Kubernetes Costs | Breaks down Kubernetes costs by cluster, node, namespace, and workload. Helps you identify top spending workloads, idle node costs at different levels, and understand your Kubernetes spend across Cloud vendors based on the enabled enrichment integrations in your account. |
| Datadog | |
| Datadog Costs | Displays Datadog usage and costs by service type, account, and integration. Useful for identifying the most expensive components and optimizing observability spend. |
| Snowflake | |
| Snowflake costs | Provides visibility into Snowflake’s total and projected spend, and cost breakdowns across accounts, services, regions, warehouses, databases, and additional resources, along with optimization insights for warehouse utilization and for identifying idle tables. |
| AI | |
| FinOps for AI Dashboard (General) | Overview of AI spending across all cloud providers.
Compare total spend, analyze AI as a percentage of overall cloud costs, and forecast future AI investments across AWS, GCP, and Azure. |
| FinOps for AI OpenAI Dashboard | A high-level dashboard to track OpenAI spend across projects, users, and models. This helps you monitor usage trends, break down cost drivers, and spot optimization opportunities before unexpected spikes occur. |
| FinOps for AI Azure Dashboard | Provides full visibility into Azure AI spend. Track service-level usage, analyze spending trends, and visualize cost distribution across models, tokens, and subscriptions. Identify optimization opportunities and monitor AI cost efficiency across your Azure environment. |
| Finops for AI GCP Dashboard | This dashboard provides a high-level view of AI spending across your GCP environment, allowing you to compare total AI spend, measure AI as a percentage of overall cloud costs, and forecast future investments. It’s a pre-built dashboard designed to help you get started quickly. To customize it—such as filtering by team, adjusting time ranges, or adding metrics—clone the dashboard and edit your version under Custom Dashboards. |
| FinOps for AI AWS Dashboard | Provides visibility into AI-related AWS services. Analyze usage and cost trends for AI workloads, compare regions or services, and track optimization opportunities. |
| FinOps for AI AWS Bedrock | Dedicated dashboard for AWS Bedrock services. View cost and usage by model, track inference patterns, and identify cost-saving opportunities across Bedrock workloads. |
| Anthropic | |
| Finops for AI Anthropic Dashboard | This dashboard provides visibility into your Anthropic spend, breaking down costs by model, workspace ID, and token type so you can monitor key drivers, identify optimization opportunities, and track overall impact on your cloud spend. |


